The breakout strategy in binary options involves trading when the price breaks through key support or resistance levels, signaling a strong price movement. To effectively use this strategy, you must understand its concept, how to apply it, and the theory behind it. It is a low-risk strategy that can lead to significant profits, and this article will guide you through the process.

Key Facts About Breakout Strategy Trading:
- The breakout strategy in binary options involves trading when the price of an asset breaks through established support or resistance levels, indicating a strong move
- Accurate identification of breakouts, including distinguishing them from false breakouts, is crucial for this strategy to be effective
- Breakout patterns can be recognized by various chart formations such as triangles, flags, and wedges
- The strategy has advantages such as limited risk and high-profit potential. However, it also carries risks such as false breakouts and slippage
What is the Breakout Strategy in Binary Options Trading?

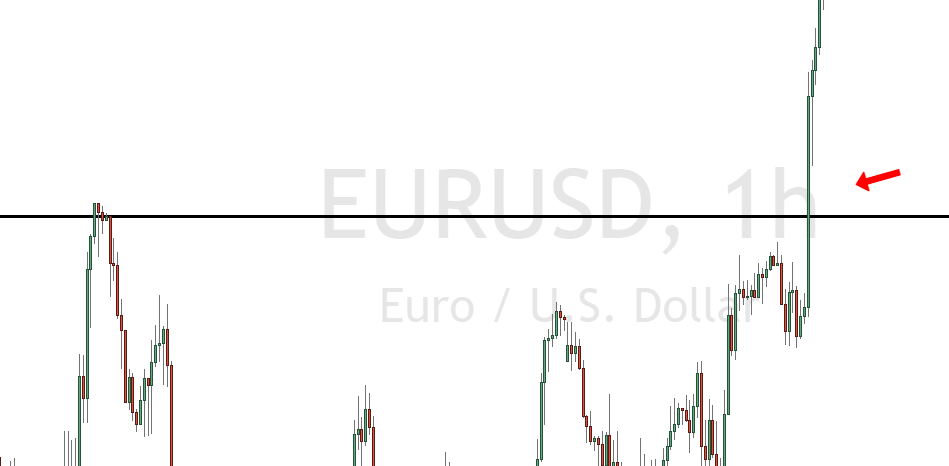
The breakout strategy in binary options trading focuses on price movements around support and resistance levels. These levels are formed when the price of an asset consolidates at certain points on the chart. Resistance occurs when the price rises above a specific level, while support forms when the price falls below that level.
When the price tests but does not break through these levels, it signals a consolidation phase. However, if the price breaks through support or resistance, this is a breakout, indicating a potential market shift. Confirming a breakout is important, as fakeouts can occur, which may lead to significant losses if you exit the trade too early.
To successfully profit from this strategy, traders wait for a confirmed breakout and take a position in the new trend’s direction. At this point, the support and resistance levels are often reversed, and traders can enter positions when these levels are breached. Analyzing price fluctuations and chart patterns is key to making informed decisions when using the breakout strategy.
What is the Underlying Theory of a Breakout Strategy?

The theory behind the breakout strategy is to enter the trade when you notice a breakout in the market. This strategy relies on two things.
Firstly, you need to identify a breakout level in the market. Secondly, you should check the momentum. If there is enough momentum for the breakout, your trade is likely to be successful.
In addition to a strong breakout level, you need strong market volume to make a successful trade. You also need to be fast and trade in high volume to make this strategy work.
Entry Signal
In order to perform binary options breakout trading you need to identify entry levels. To identify the entry level you have to look for break levels. The break level is the point at which the price of an asset crosses the identified level.
Trade Timing
Trading binary options at the right time are crucial because you can lose a well-planned trade if you fail to pick the right time.
Elements of a breakout
Breakout is a sudden directional move of price, and it comes in different varieties. Here are a few common breakout elements.
Volatility
When there is heavy buying and selling in the market, it results in unstable market conditions and increases market volatility. When volatility in the market increases, the possibility of a trend forming in the market rises.
Market Participation
If there is an increase in the volume of assets, it affects breakout. When this happens, the market participants hope to open long and short-term positions to make more profit.
Directional Move-In Price
Directional move in price is the product of heightened volatility and increased market participation. If there is no directional move in the price, the market breakout will not take place.
Each of these market elements is important, and they affect each other. That’s because an increase in market participation leads to more volatility. And this further creates a new trend in the market.
A breakout trading can occur in any market condition. If you want to gain profitability from this strategy, you can use it in the equities, forex, and futures markets.
How to Identifying a Breakout?

It’s essential to identify breakout to trade binary options successfully. You can find breakout by using one of the four ways.
Support and Resistance
The first way you can identify a breakout in the market is by looking for support and resistance. It is a way of doing technical analysis.
Some common examples of technically derived support and resistance are pivot points, Bollinger Bands, moving averages, and Fibonacci retracements.
Chart Patterns
One of the popular ways of identifying a breakout in trading is by using chart patterns. Candlesticks, flags, and pennants are some of the common chart patterns.
Market consolidation
Sometimes, when the market is consolidating, it indicates a period of indecision in the market. In this case, the market participants enter the trade and take the price either up or down.
Periodic News Release
Another way of identifying a breakout in the market is by looking for periodic news releases. A major financial news act as a catalyst in moving the price.
What Are Different Breakout Patterns for Binary Options?
The price of an asset breaks the level of support and resistance in different patterns. Here are a few of them.
Symmetrical Triangle

The symmetrical triangle in the trading chart shows that the market is in indecision mode. You can spot a symmetrical triangle when the price is alternate lower highs and higher lows in upside and down slopes.
Ascending Triangle

You can spot an ascending triangle when the market price is making higher highs and higher lows. It usually indicates bullish price action.
Here, the ascending triangle is bound by two trend lines. The line connects an upward slope and a horizontal line at the top.
Also, the triangle price must intersect the trend line twice before completing the pattern to make a successful ascending triangle.
Descending Triangle

This breakout pattern is the completely opposite of descending triangle. In this case, two trend lines bound the triangle. However, these lines connect horizontal trend lines at the bottom and downward slope.
The price must intersect trend lines twice to form a strong descending triangle.
Bull Flag

The bull flag in the breakout trading strategy indicates a temporary pause in the trend. You can spot this pattern when the market breaks out by the tight formation of lower highs and lower lows.
Bear Flag

The bear flag is the opposite of the bull flag. This pattern occurs when the market consolidates during a downward trend. Bear flag forms higher highs and higher lows.
Rising Wedge

In a rising wedge, there are higher highs and higher lows, which converge at the top. A rising wedge is a bearish pattern, and it occurs in downtrend and uptrend markets.
Additionally, this breakout pattern has a high failure rate as compared to other trading patterns. Also, this pattern makes trading in breakout difficult.
Falling Wedge

A falling wedge indicates lower highs and lower lows in the market. Here, the trend line diverges at the bottom.
Just like a rising wedge, this pattern also has a high chance of failure. But that’s because falling wedge offers several false signals.
Using Breakout Strategy While Trading

You can use breakout strategy in binary options trading in two ways: short duration options and long duration options.
Short Duration Options
Short duration options trading means you can exit the market in between 5 to 30 minutes. For short-term trading, you can use the indicators that are generally used for 60 seconds trading.
Also, the market should be in a neutral trend for successful short-term trading.
Long Duration Options
If you want to trade long-duration options, you can exit the market anytime between 4 hours to 1 day. For long-term trading, you don’t need to wait for the market to have any defined trend.
What Are Advantages and Disadvantages of Breakout Trading with Binray Options?
Just like any other trading strategy, a breakout strategy also has certain advantages and limitations.

- Limited risk
- Trade management
- Profit potential
- False breakouts
- Slippage
- False breakouts
- Slippage
Conclusion: Stick to the proven breakout strategy and make a winning trade
There are several benefits and limitations of using the breakout strategy for binary options trading. But if you know how to identify breakout and use this strategy, you can increase your trading profitability.
Also, you should stay alert while using this strategy as false breakouts might make you lose all your investment. So, stick to a proven strategy and trade accurately to make winning trade.
Most Asked Auestions:
What is the breakout strategy in binary options trading?
The breakout strategy involves trading when an asset’s price breaks through key support or resistance levels, signaling a potential shift in market direction. Traders look for confirmed breakouts, avoiding false breakouts, to enter a position in the new trend’s direction, often with low risk and high profit potential.
How do I identify a breakout in binary options?
You can identify a breakout by observing key support and resistance levels, chart patterns like triangles or flags, and market consolidation. When the price breaches these levels, it signals the breakout, but confirmation is crucial to avoid false breakouts.
What are the key elements of a breakout?
Breakouts are driven by three key elements: volatility, market participation, and a directional price move. Increased volatility and volume typically lead to a stronger trend, while a lack of direction may prevent a successful breakout from occurring.
What are the advantages of using a breakout strategy?
The breakout strategy offers limited risk, predefined market entry and exit points, and the potential for significant profits if the market moves as anticipated. It’s a relatively low-risk strategy during consolidating market phases, allowing for quick exits if the trend reverses.
What are the risks of the breakout strategy?
While breakout trading can be profitable, false breakouts and slippage are common risks. False breakouts can lead to significant losses if you exit too early, and slippage can occur when asset prices change rapidly, making precise entry difficult.


