The line chart strategy in binary options trading uses the RSI indicator to identify overbought and oversold conditions. In this article, we will give you more insight into the strategy and provide you with helpful information on how to use it and apply it to your next binary options trading session.
What is the Line Chart Strategy in Binary Options Trading?

The line chart strategy in binary options trading is a straightforward method where traders rely on simple line charts to guide their decisions. In this approach, the asset’s closing prices are plotted as a continuous line, reflecting the overall price trends over a set period. Traders use these trends to identify market direction—an upward slope suggests rising prices, often signaling a potential ‘call’ option, while a downward slope indicates falling prices, which may suggest a ‘put’ option.
Line charts also help identify support and resistance levels, which are crucial points where the asset’s price has historically reversed direction. These levels are key indicators for predicting future price movements. Additionally, traders watch for breakouts, where the price moves beyond these levels, or reversals, where the price changes course, to make informed trading decisions.
How To Use the Line Chart in Binary Trading Effectively
If you are getting a condition where the overbought reading is 80 RSI and the oversold reading is 20 RSI. Then move forward; you’re then, again, getting the right signals according to 3 periods RSI. Let’s see which strategy you can try.
#1 Finding Less Than 50

Understanding this step is crucial as it sets you up for the next actions. This is a simple process to follow.
Start by identifying the candlesticks that are below the 50 RSI level. Then, look back at 50 candles to the left of the selected bar. Draw two vertical lines at these points once you’ve pinpointed the starting and ending candlesticks.
These vertical lines will help you assess the oversold or overbought conditions. Be sure to accurately count the candles from left to right to ensure you’ve correctly identified the endpoints.
#2 Find the RSI Below 20
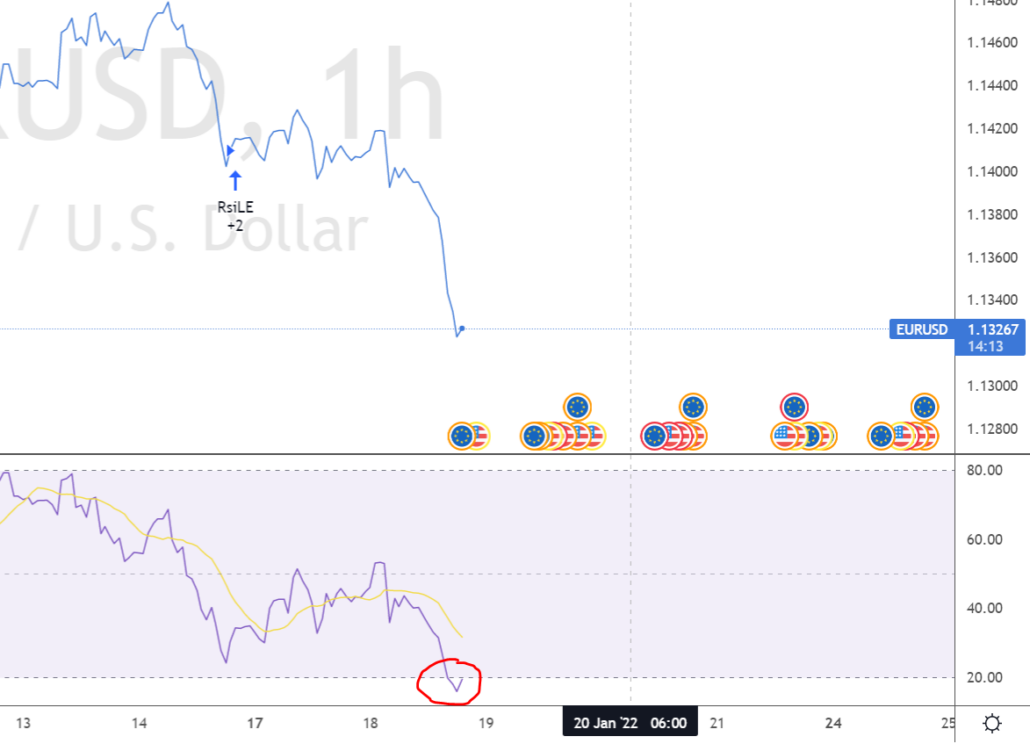
Now that you’ve identified the 50 RSI, the next step is to look for the 20 RSI. By now, you likely understand that this is part of a reversal trading strategy.
If you’re wondering about the purpose of this step, here’s the explanation. The 20 RSI indicates an oversold condition, signaling a potential bullish reversal. Since it’s a reversal case, there’s a strong chance that the market will eventually become overbought.
Regardless of whether you’re trading commodities, crude oil, stocks, currencies, or other assets, these two conditions will always be useful. To enhance your trading and increase your chances of success, consider using both conditions together as part of a confluence strategy.
#3 Search for the Bullish Development

Here’s the answer if you’re wondering how the confluence factors can help you make extra profits. The more accurate and precise your trading, the better your edge in the market. Confluence provides clearer, more reliable signals.
Now, let’s dive into the bullish divergence method. The steps you’ve followed so far will be helpful because the reversal strategy is in play. The candle you’ve identified already shows a lower price, and the right side of it will signal positive price action. This means both the RSI and price action will move in opposite directions but with increased momentum.
Another way to spot a potential reversal signal is by checking the direction of the momentum indicator. It shows you the resulting effect and price and momentum should move in opposite directions for the best results.
#4 Find the Closest Candlesticks of the Next 50 Candle

Now that you’ve marked the previous 50 candles, spotting the next one becomes much easier. Draw a horizontal line connecting the points of the previous 50 candles. The area between them will highlight where the price is decreasing.
At the point where the line closes, you’ll notice the price is starting to increase. This is your signal to place a call option, which can be seen as a buying opportunity. Once everything is in place, you can decide how much to invest. These steps take just about 60 seconds, which is why it’s often referred to as a 60-second call option.
#5 Time To Gain Profit
To ensure our steps lead to profit, it’s crucial not to overlook this moment. If we fail here, all our efforts will be in vain. Let’s walk through how to avoid that.
When aiming for profit, wait until the candle approaches your target candle. It’s easier to explain this with a clear example.
If you plan to invest $100 in binary options trading, look for candles with a value lower than 50 and check the 20-candle range. Draw a horizontal line at the 50-candle mark.
Once the next set of 50 candles touches the horizontal line, it’s time to make your $100 investment. Monitor the candlesticks (or line chart) closely, and set your profit target. When the price reaches your target, it’s time to withdraw. With a 65% profit percentage, you’ll earn an additional $65 on top of your $100 investment.
Conclusion: Use line charts to trade binary options
Line charts are popular for these simple reasons. Bar charts are also helpful, but you don’t get this many opportunities. Always follow the line chart if you are a professional binary trader and want to invest in specific trading.
Most commonly asked questions about line chart binary options trading:
What is the line chart strategy in binary options trading?
The line chart strategy in binary options trading involves using simple line charts to track an asset’s closing prices over time. This approach helps identify market trends, such as rising or falling prices, and supports making informed trading decisions. Traders use the Relative Strength Index (RSI) to spot overbought (above 80 RSI) and oversold (below 20 RSI) conditions, which can signal potential reversal points for trading opportunities.
How do I use the RSI indicator with the line chart strategy?
To apply the RSI indicator effectively in the line chart strategy, look for candlesticks with an RSI value below 50. Then, count back 50 candles and draw vertical lines at the beginning and end of this range. This allows you to assess overbought and oversold conditions, and helps you decide when to invest, based on market trends and potential price reversals.
What is the significance of an RSI value below 20?
An RSI below 20 indicates an oversold condition, which is often a signal for a potential bullish reversal. When the market is oversold, it can be expected to eventually become overbought, presenting a profitable opportunity for traders to buy. This strategy can be used across various asset classes, including commodities, stocks, and currencies, and is particularly useful in conjunction with other indicators for enhanced trading accuracy.
How does the confluence strategy improve trading accuracy?
The confluence strategy involves combining multiple indicators to improve the reliability of trading signals. In this context, it combines the RSI indicator with price action to identify potential reversals. When price action and momentum indicators move in opposite directions, this can signal a strong reversal opportunity, providing more precise and dependable trading signals.
How do I calculate profits using the line chart strategy?
To calculate profits, wait for the next set of 50 candlesticks to touch the horizontal line drawn from the previous low point. Once the price starts increasing, this signals a call option or a buying opportunity. By following the steps accurately, you can expect a 65% profit on your investment. For example, with a $100 investment, you can earn an additional $65 in profit when the price reaches your target.


