Are you having trouble making money in Olymp Trade? Have you considered employing trading indicators to help you identify trade directions and improve your odds of winning?
If you haven’t already, try prioritizing trend indicators in 2022 to increase your odds of winning.

It makes no difference whether you’re a swing trader or a day trader. What important is that you can make a lot of money at the closing of every trading day.
Such indicators are available in Olymp Trade and can be used to assess market volatility or to predict trending directions. Only the Olymp Trade indicators are discussed in this post.
What you will read in this Post
(Risk warning: You capital can be at risk)
1. MACD (Moving Average Convergence Diver)
MACD indicator – a histogram featuring dynamic columns and two moving average lines having different settings.
These components indicate the present trend’s strength and provide cues for effective trade entry.

The primary benefits of trading with this indicator include the fact that it combines three indications at once, is suited for all currency pairs, and enables you to make up to 90% profitable trades.
What exactly do the indicator and strategy mean?
- The MACD indicator can be used on both a line chart and a candlestick chart to show when a trend is changing (for instance, from ascending to descending).
2. RSI (Relative Strength Index)
The RSI (relative strength index) is a very powerful technical indicator offered by binary options brokers that may provide you with accurate alerts to begin trades at any time of day or night.

This indicator has the following characteristics:
- Works on trend reversal
- Perfect for 5 to 15-minute transactions
- It performs well on the currency pairings EURAUD, GBPEUR, and EURUSD.
What is the strategy’s main point?
- As you would be familiar with, the pricing of a currency pair changes throughout the day. The fluctuation in the price curve is often seen in the trading corridor, for example, within the customary ranges from 30 to 70.
- As a result, the price occasionally exceeds the trading corridor’s boundaries (it becomes lower than 30 or even higher than 70). Whenever the value is over 70, the market is in an overbought state. The market is termed to be oversold whenever the price goes under 30.
- We notice the pattern has switched when the signal lines return to the trade corridor’s limits.
(Risk warning: You capital can be at risk)
3. Simple moving average
The following are the primary benefits of trading using this indicator:
- It is simple to learn. It’s simple to personalize. A high percentage of lucrative deals is displayed.
- The SMA (Simple Moving Average or Simple Moving Average) is a popular and easy-to-use technical indicator. It indicates the average price within a given period.
- SMA can be both fast and slow.
Many people on Olymp Trade employ two moving averages, SMA with distinct periods: 60 and 4, to improve the trading strategy’s efficiency.

With a period of 60, the Slow SMA depicts a smoothed price movement that excludes random oscillations.
4. Bollinger Bands
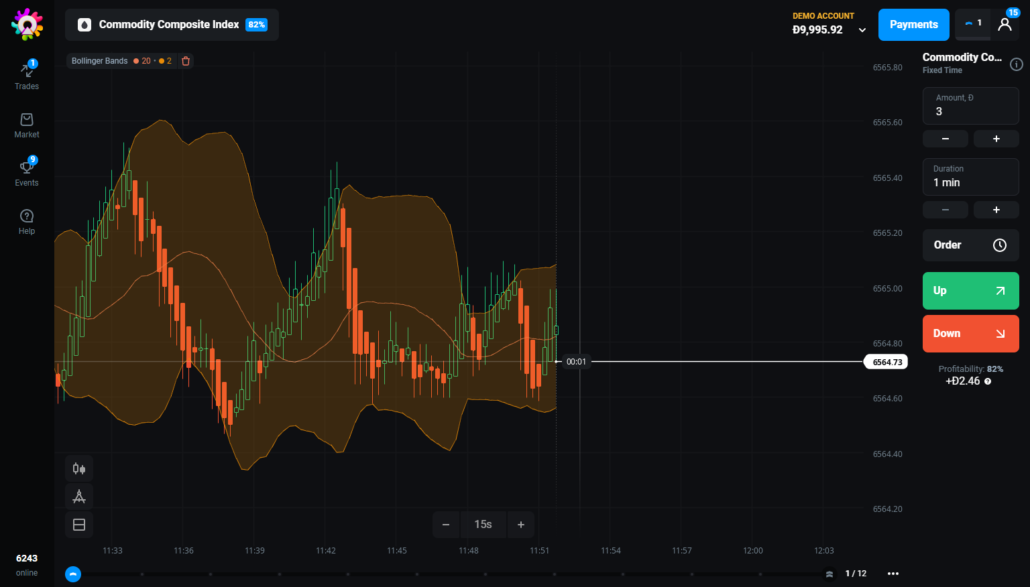
Bollinger lines are oscillator-based trend indicators. Oversold and overbought market stages are indicated by the bars.
Three primary bands (lines) make up the indicator:
- The center band represents an SMA price.
- The higher and lower bars show recent price levels where the price is regarded to be quite high or low relative to the moving average.

This method works best with the following assets: Metals – gold, silver, oil as well as EUR/USD, GBP/USD, USDCAD, USDCHF, and EURJPY are the currency pairs. On the promotions front, there’s Coca-Cola, IBM, Google, Apple, and Tesla.
(Risk warning: You capital can be at risk)
5. Stochastic
Among the most popular and efficient indicators is stochastic. It clearly depicts the reversal of the trend. The essential features of this indicator are as follows:
- Indicates a reversal of the trend
- It can be used with any currency pair

The stochastic indicator tells us when the market is overbought or oversold. It comprises two moving average lines, as you can see. The color red indicates a signal, while the color blue indicates that the signal has been confirmed. Lines in the range of 0 to 100 should be moved.
Attention!
- It’s crucial to pay attention to the times when they’re over level 80 but below level 20.
- If the red line is above 80, it indicates that the market is overbought and that the price will soon begin to decrease.
The market is oversold, and the price will soon begin to rise if the signal line is below level 20.
Few popular strategies for Olymp Trade trading
For your convenience, the Olymp Trade trading system has been gradually expanding the number of technical indicators. How can you avoid getting lost in all of the options and pick instruments that wonderfully complement each other while avoiding signal duplication? In reality, a large portion of these instruments can be classified into two categories: oscillators and trend indicators.

Indicators from several groups are frequently utilized to find the ideal combination. Yes, it’s that easy. There are a few outliers as well. The Ichimoku Cloud, which belongs to both of these groupings, as well as Bollinger and ATR bands, which are volatility indicators, are among them.
Here are a few of the finest Olymp Trade indicators.
(Risk warning: You capital can be at risk)
1. Bollinger Bands
A moving average and two bands, one above and one below the MA, make up the indicator. When these bands are far apart, it implies that there are a lot of price fluctuations. Whenever the candles cross over the bottom bar, it is a buy indication.

When the upper line of the chart crosses the lower line downwards, it is a selling indication. A reversal is witnessed whenever the candles surpass the moving average in any direction.
2. Average Directional Movement Indicator (ADX or DMI)
The trend’s strength is represented by the ADX. It’s a leading indicator that’s usually used in conjunction with the default settings.
It can be employed alongside Bollinger Bands.
The greater the trend, the further apart the red and green lines are. A bullish trend is indicated by the red line crossing the green line upward. The trend is bearish when the red line crosses the green one upwards.
3. Fractal
The Fractal’s main purpose is to display the price curve’s minimum and maximum points as well as trend reversal points on the chart. Many traders utilize it to assist them in determining the levels of support and resistance.
When the highest candlestick in the center is followed by two lower candlesticks, the Fractal indicator indicates a downtrend. An upswing is signaled when the lower candle is accompanied by two successive candlesticks with the Fractal facing downwards.
4. Awesome oscillator
The Awesome Oscillator is a lagging indicator that follows the price and hence does not predict future developments. It works best during trending periods. The MACD indicator is considered a simplified form of it.

A Buying signal is obtained whenever the bars shift from underneath to just above the average, whilst a Selling indication is observed when the bars shift from above to below the base point.
(Risk warning: You capital can be at risk)
5. Detrended price oscillator (DPO)
This indicator is intended to isolate the impact of the overall trend from price action, making it easier to spot cycles. Short-term traders who aren’t interested in the long-term trend may find it useful. The difference between the previous price in a cycle and the moving average is measured by DPO.
When the price moves above the average, for example, it is positive; when it drops below the average, it is negative. This indicator is a helpful tool that may be used in conjunction with the Alligator or MACD to make more precise predictions.

More experienced traders can tweak the settings of these indicators, but they can all be used with the default values. Please keep in mind that no indicator can guarantee 100 percent performance all of the time. Thus risk management is always required.
Before you use trading indicators, there are a few things you should know
The first rule of trading signals would be to never utilize a single indicator separately or several signals at once. Concentrate on several that you believe are most suited to your goals. Technical indicators must be utilized in combination with your personal assessment of the price movements of an instrument across time (‘price action’).
It is important to remember that you must verify a signal in some form. If one indicator gives you a ‘buy’ signal, but the price action gives you a ‘sell’ signal, you’ll need to use multiple indicators or time frames till your signals are verified.
Another factor to bear in mind is that you should never lose sight of your trade approach.
Final thoughts on Olymp Trade indicators
Technical analysis is a sort of financial forecasting that looks at trading data to see if there are any patterns that can be used to anticipate future prices. Considering its appearance, technical analysis is not very challenging.

Today, we’ve highlighted five prominent indicators that most traders utilize with the Olymp Trade platform, and you don’t even need to know how to calculate them. The foundation of any trading system is technical indicators. They can be utilized to forecast market patterns, estimate entry and exit locations, and calculate profit possibilities. So, which indicators do you employ?
(Risk warning: You capital can be at risk)


